Yuval Adam
- Full stack developer and systems architecture consultant
- But I also like to play with radios
- https://yuv.al
- @yuvadm
This talk
- I never learned physics, RF engineering or signal processing
- But radios are pretty cool!
- Hopefully in 25 minutes I can show you some neat things
Agenda
- What are radio waves?
- Hardware vs software radio
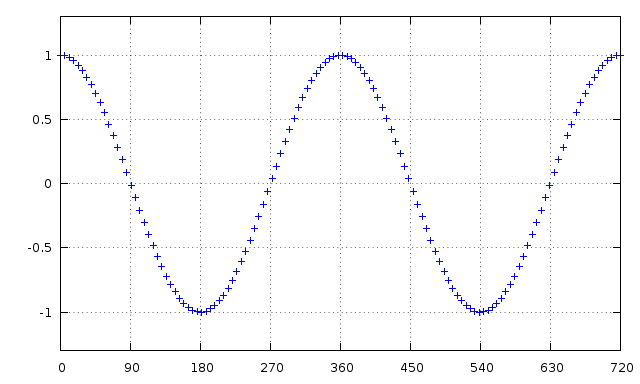
Radio Waves

RTL-SDR
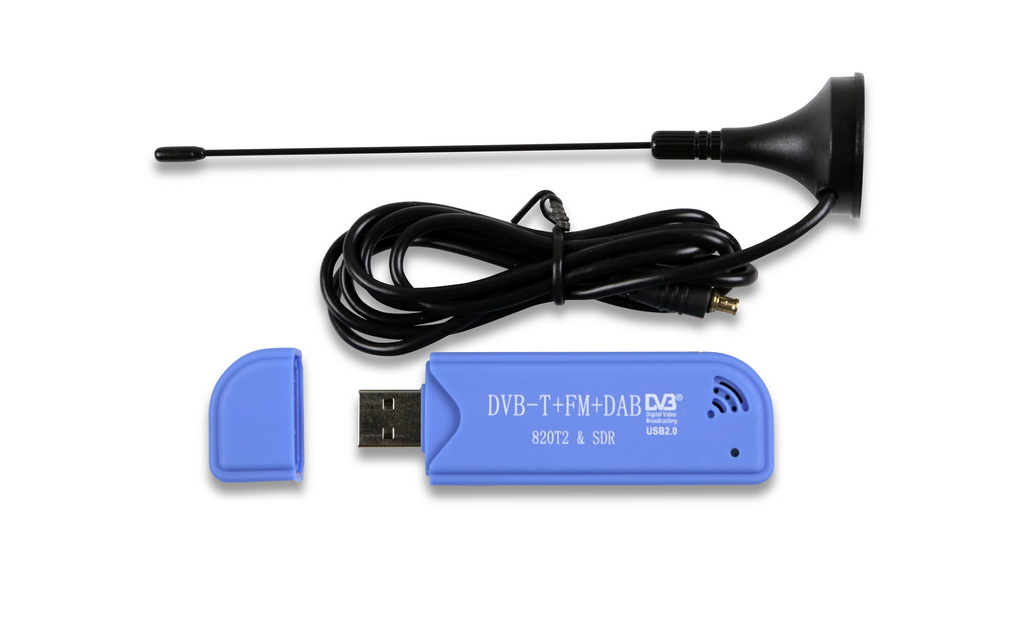
What's it good for
- Digital TV broadcast ("Idan+", DVB-T)
- Airplane tracking (ADS-B)
- Weather satellites
- FM radio broadcast
I/Q Sampling
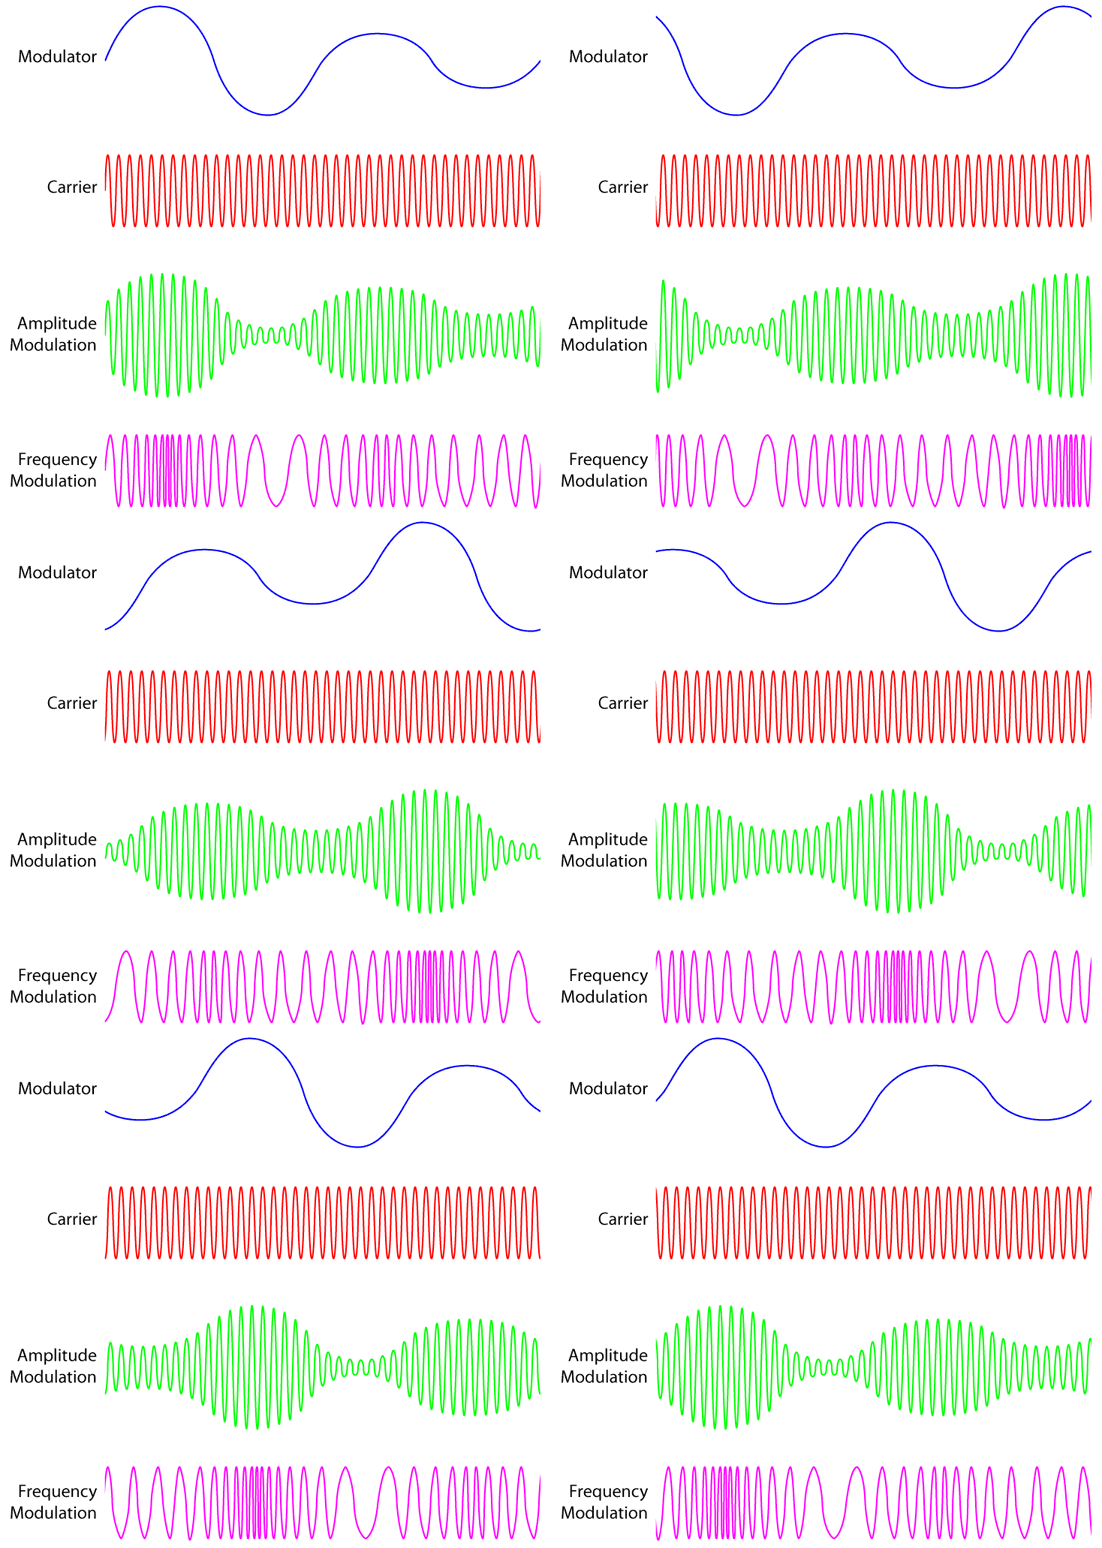
Modulations
In [ ]:
import numpy as np
import matplotlib.pyplot as plt
In [ ]:
modulator_frequency = 4.0
carrier_frequency = 40.0
modulation_index = 1.0
size = 44100.0 * 2

time = np.arange(size) / size
modulator = np.sin(2.0 * np.pi * modulator_frequency * time) * modulation_index
carrier = np.sin(2.0 * np.pi * carrier_frequency * time)

product = np.zeros_like(modulator)
for i, t in enumerate(time):
    product[i] = np.sin(2. * np.pi * (carrier_frequency * t + modulator[i]))

modulator = np.sin(2.0 * np.pi * modulator_frequency * time) * modulation_index
amp = np.zeros_like(modulator)
for i, t in enumerate(time):
    amp[i] = np.sin(2. * np.pi * (carrier_frequency * t * modulator[i]))
In [ ]:
plt.subplot(4, 1, 1)
plt.title('Frequency Modulation')
plt.plot(modulator)
plt.ylabel('Amplitude')
plt.xlabel('Modulator signal')

plt.subplot(4, 1, 2)
plt.plot(carrier)
plt.ylabel('Amplitude')
plt.xlabel('Carrier signal')

plt.subplot(4, 1, 3)
plt.plot(product)
plt.ylabel('Amplitude')
plt.xlabel('Output signal')

plt.subplot(4, 1, 4)
plt.plot(modulator * carrier)
plt.ylabel('Amplitude')
plt.xlabel('Output signal')
plt.show()
In [ ]:
# pyrtlsdr provides us bindings to work with the RTL-SDR driver

from rtlsdr import RtlSdr

sdr = RtlSdr()
sdr.sample_rate = 1.2e6       # 1,200,000 samples per second
sdr.center_freq = 91.8e6      # 91,800,00 Hz frequency for the radio station
sdr.gain = 'auto'             # tune the gain (AKA "volume") automatically

samples = sdr.read_samples(8192000)  # collect samples during 5 seconds
sdr.close()

print(samples[:5])
In [ ]:
# Load the samples into a numpy array

import numpy as np

samples = np.array(samples).astype('complex64')
In [ ]:
# We captured too many samples so we need to apply a low pass filter
# In other words, we have a too large window and we want to make it smaller

import scipy.signal as signal

BANDWIDTH = 200e3
DECIMATION_RATE = int(1.2e6 / BANDWIDTH)

samples = signal.decimate(samples, DECIMATION_RATE)
In [ ]:
# Apply the demodulation, we use a polar discriminator

samples = np.angle(samples[1:] * np.conj(samples[:-1]))
In [ ]:
# De-emphasis filter - too "sciency"
# MAKE THINGS SOUND BETTER

d = BANDWIDTH * 75e-6
x = np.exp(-1/d)
b, a = [1-x], [1,-x]
samples = signal.lfilter(b, a, samples)
In [ ]:
# Decimate the signal down to something an audio driver can handle
# We only catch the mono part of the signal

AUDIO_RATE = 50e3
DECIMATION_RATE = int(1.2e6 / BANDWIDTH / AUDIO_RATE)

samples = signal.decimate(samples, DECIMATION_RATE)
In [ ]:
# HIT IT

whatever.play(samples)
Caveats
- Python, NumPy and SciPy are very good at doing fast processing of static data
- When handling real-time data, buffering becomes a serious issue
- GNU Radio
- top-notch framework
- implemented many signal processing primivites
- has a great scheduling engine